Time for us to take a look at another LED LCD TV from LG Electronics! This one is the 42LM660T, which features 4 HDMI inputs, a DVB-T2 (Freeview HD) tuner, built-in wireless connectivity for easy access to the company’s Smart TV portal, and, as usual for LG, fully-featured calibration controls, complete with Imaging Science Foundation (ISF) branding. In terms of extra-dimensional support, the LG LM660T features the Korean manufacturer’s passive “Cinema 3D” technology, which we’ll discuss later in the review.
LG is one of the biggest proponents of In-Plane Switching (IPS) LCD panels, and use them more or less exclusively in its LCD and LED LCD lineups. IPS panels can’t manage the deepest black levels in the LCD market (and are some way away from plasma black level standards), but they’re in the top of nearly every other category, typically producing better motion clarity, uniformity, and certainly off-angle viewing quality than competing LCD panel types. (Panasonic and Philips also use IPS extensively in their LCDs).
The LG 42LM660T sits below the LM760, LM860, and LM960 series in the brand’s LED LCD lineup. The differences seem to largely be with the panel’s motion clarity rating, although spec sheets also mention different upscaling quality being present higher up in the range. Time to put the HDTV through our extensive testing, and find out if it’s worth the asking price!
For this review, the firmware was updated to the latest version at press time: 04.01.36.
Note: Although we did not test the larger, 47-inch LG 47LM660T, our picture performance findings should still apply given similar specifications within the LM660T range.
LG’s 42LM660T is stunningly designed, with the LCD screen actually being covered by a design that reminds us of the “one-sheet-of-glass” style used on some flagship plasma TVs. We say that it reminds us of this, because the front is actually not glass, but a similar-looking (albeit less reflective) plastic material. The “wow factor” is the same, however, especially with the tiny black border around the screen and silver trim around the outer edge. Letting the aesthetics down slightly is a gloss-black plastic table-top stand.
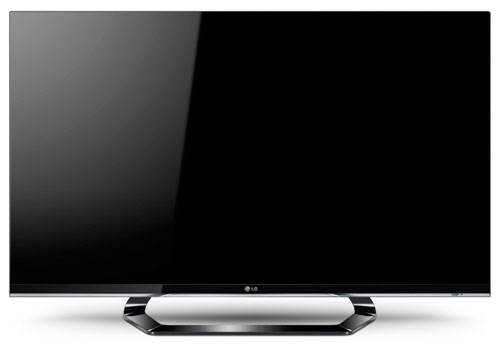
One very minor point to mention here is that, since the border is part of the front sheet which covers the LCD panel, the two components (outer sheet and LCD panel) can be misaligned slightly. On our sample, this caused roughly half a pixel (but sometime a whole pixel)’s worth of screen to be covered on each edge, causing the white outer stripe on our overscan test chart to be partly blocked by the border. We’re certainly not about to lose sleep over half a pixel, though, and mention it for completeness.
LG ships the 42LM660 with not one, but two remotes. The first is the company’s standard clicker, which is logically designed and easy to use. There’s no direct control over aspect ratio, but that turns out not to be a problem, because the Q.MENU button brings up a pallette of options (including Aspect Ratio), so it’s only one extra button press away.
The second remote is LG’s “Magic Remote”, which is probably the first genuinely useful secondary remote we’ve seen to date. Typically when we see secondary remotes (which are often just simplified versions of the main remotes with only volume and channel buttons) we find that the dust soon begins to gather, but the Magic Remote is genuinely impressive, for a few reasons. First of all, despite the fact that it only features nine buttons (counting the clickable scroll-wheel), it isn’t hobbled in terms of functionality – every useful option (and from our point of view, that of course includes the picture menus!) can be accessed through it. Secondly, it’s actually fun and very accurate to use, acting more or less like Nintendo’s Wii remote: a pointer appears on screen, allowing the user to select icons effortlessly by pointing and clicking.
We still preferred to use the traditional remote for calibration, given the precise adjustments being made (pressing a button 3 times is easier than trying to drag a slider 3 notches with your hand), but for everyday use, the Magic Remote should do the job just fine.
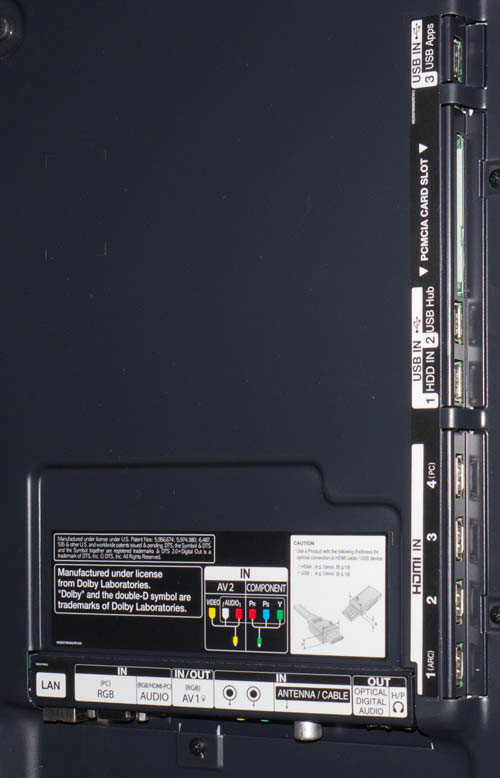 |
| Rear connections on LG 42LM660T |
LG’s menus haven’t changed too much over the last few years, and that’s fine by us, since there’s nothing that needs fixing. There’s now a “HOME” button on the remote, which brings up the Apps interface, which is a neatly tiled, horizontally scrolling main menu system. A shortcut to “Settings” is listed beside “Input List” as one of the preinstalled “apps”, and clicking this brings us to the main menu we’ve known for some time. There’s still direct access to this menu with a dedicated SETTINGS button on the remote.
![[Picture] menu](https://www.hdtvtest.co.uk/news/wp-content/uploads/2018/04/hdtv_LG-42LM660T_picturemenu.jpg) |
| [Picture] menus |
LG has been including ISF-approved picture modes – which offer a full range of calibration options – consistently for some time now. The 42LM660T is no different, and has the usual “ISF Expert1” and “ISF Expert2” modes, which can be transformed into fully configured Day and Night modes by an ISF calibrator. In addition to basic adjustments, a full range of image adjustment options is available, including not just 2-point Greyscale control, but also a 20-point option, which is the highest level of greyscale calibration precision available (and is probably more than the panel will actually need). There’s a three-axis colour management system (CMS) available, too.
| Jump To: 1. DesignNext: Calibration3. Performance |
jQuery(document).ready(function($) { var toc = $("#tableofcontents").html(); $("#tablecontents").html(toc); });